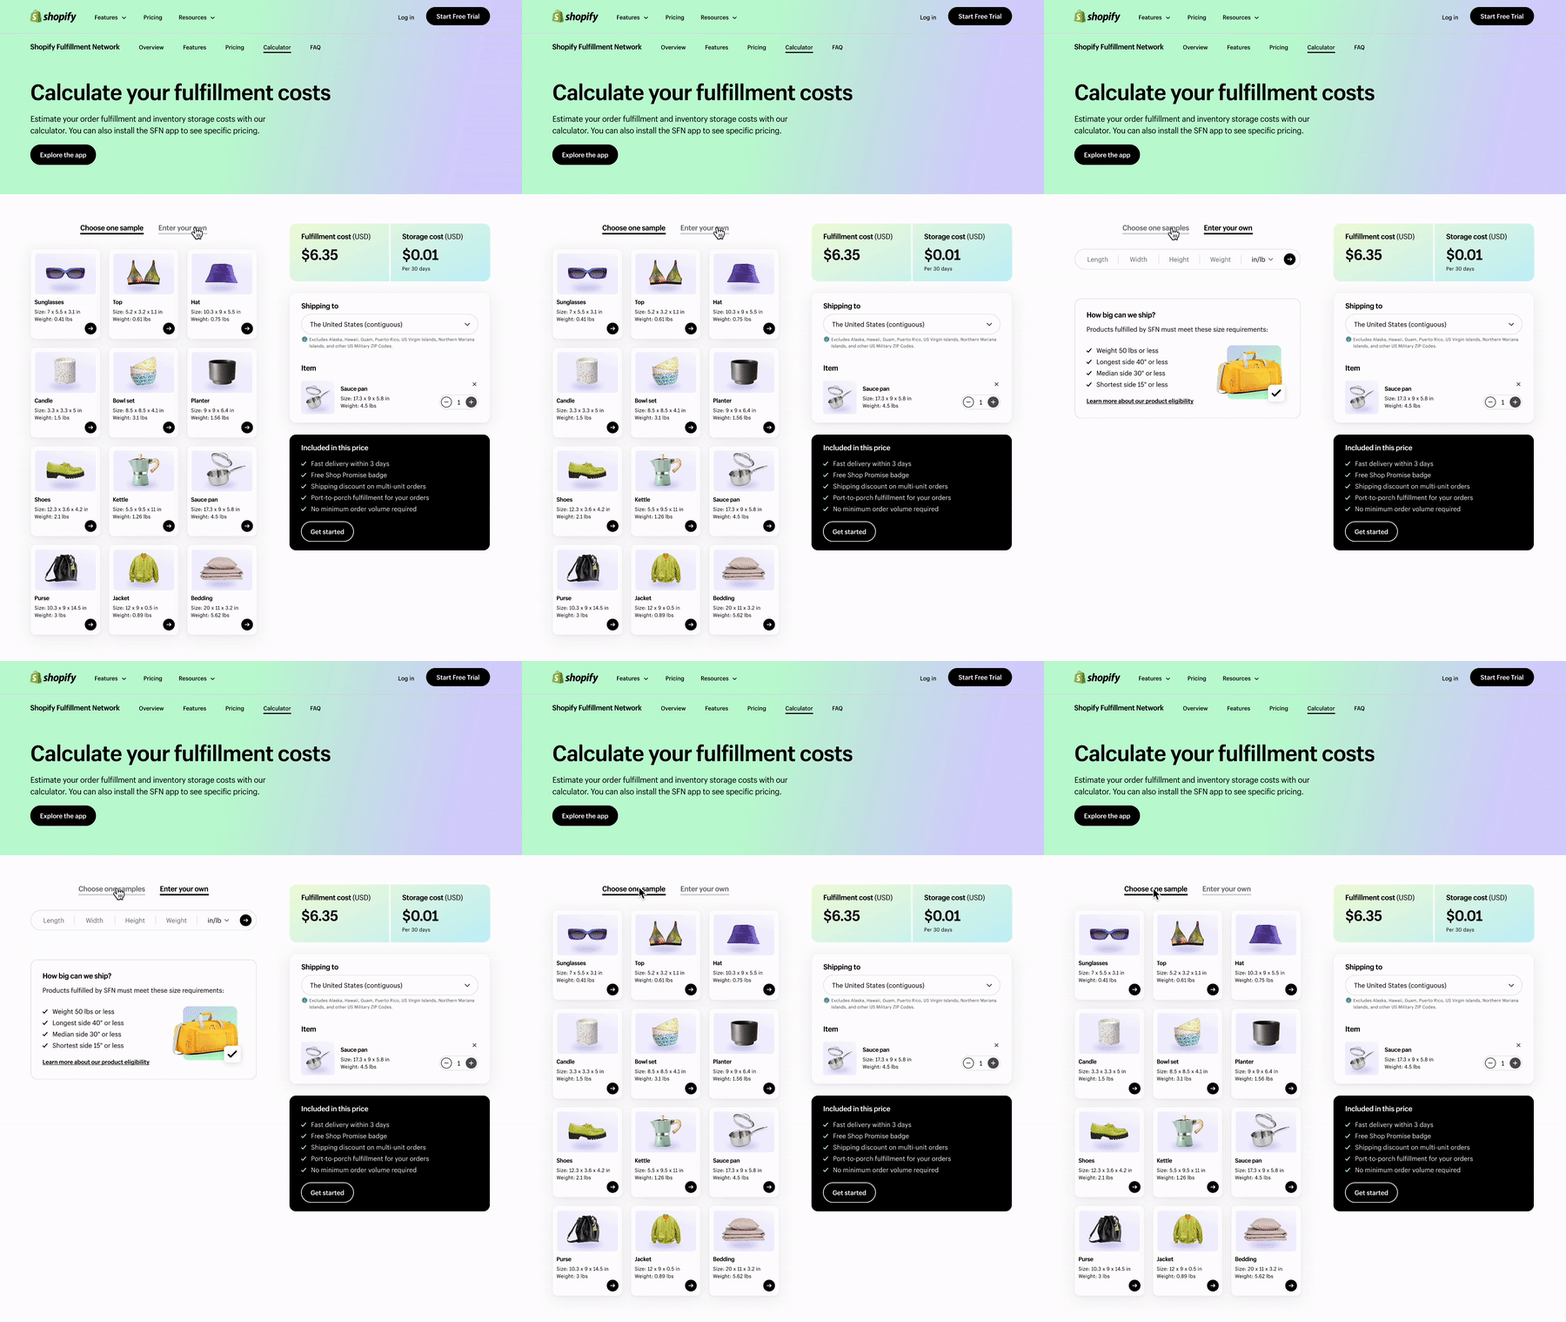
Fulfillment cost calculator
This calculator helps merchants understand how much it will cost them to have their products stored and shipped by Shopify.
Company
Shopify
Role
Product Designer &
Project Manager
Duration
10 weeks
Team
Kaspar So - Sr. Dev
Sheri Soliman - Staff Dev
Nicole Belcher - Sr. Marketing Designer
Emily Keefe - Content
Sairah Anwar - PM
Overview
This calculator is trying to solve one of the biggest problems for small business owners in choosing a fulfillment service: the lack of pricing information.
Small business owners struggle to assess the value of Shopify Logistics (SL) because the pricing information is easily accessible. But at the same time, it’s a common business strategy within the fulfillment industry to not share pricing information until the target users have shown a certain degree of commitment.
Our solution is to launch a cost calculator on the marketing site. It gives potential users a general idea of our pricing range without giving out the details.
proposal
On Feb 2023, Shopify launched its self-serve fulfillment service. However, the support team was under great pressure to answer more questions from merchants. One of the top questions was about pricing.
From Feb 3rd to March 31st in 2023, 29.9% of support tickets (118 out of 394) were about pricing.
Merchants found it hard to compare different fulfillment services on the market without more pricing information, and they usually have to talk to a sales representative to get price breakdowns. It’s a common practice in the fulfillment industry to hide the pricing information until the target users are more committed.
To make Shopify Logistics (SL) more competitive and reduce the workload for our support team, we need to find a way to offer potential users more pricing information without giving them the actual rates.
Research
To better understand user needs and industry standard, we conducted three types of research. They are competitive research, merchant survey, and sales calls. Please click the tabs below to see details.
We sent out 500 surveys to merchants who have searched "logistics" or "fulfillment" on Shopify and asked them what they wanted to know about logistics pricing. And this is what 356 merchants told us.
Ideation
From the user research, I realized that there are two types of merchants that could be our potential users. They both need more pricing information, but they also expect different additional information based on their situations.


I also mapped out the current user journey for a merchant to get a quote from a fulfillment provider, which was extremely frustrating.

I organized two brainstorming sessions with the project team and UX team to synthesize and analyze the research results.
From the first brainstorming session, we made two major decisions:
01
surface pricing information in a self-serve way.
We decided to allow merchants to download the rate card in the SFN app. They no longer need to talk to anyone to get it.
02
calculate the cost for merchants.
Since merchants need a reference to compare the prices among different providers, we will give them examples or calculate the cost of their own products.
From the second brainstorming session, we came up with multiple features to include and voted out the main ones.
Shipping cost
Product link
Storage cost
Manual entry
Shipping speed
Order cart
Product samples
prototype
I created different wireframes to illustrate these core features, and we did A/B testing with users, stakeholders, design team, as well as our cross-functional team.


Based on the feedback from the project team, the full-page design is a better option because it's easier to manage and better for marketing with its own URL. And we decided to put the "Product link" feature aside for future iterations because of technical limitations.
Based on the feedback, I created hi-fi prototypes and went through several iterations with the UX craft team.


The designs are largely similar with some differences in the layout, visual design, and sample categorization. Eventually, the team agreed on the final design based on the following observations and assumptions:
-
The fulfillment cost and storage costs are the most important information for merchants, followed by shipping areas.
-
Merchants want to focus on one task at a time, so the sample selection and manual input should be separated.

design system
The calculator locates on the Shopify marketing site, so Shopify Polaris Design System is not applicable here.
At the time of this project, the Shopify markting team just started building their own design library, and I became part of the team to build and complete the library.


testing
Before going into build, we invited 6 potential merchants to do usability testing. And here's what we found.
01
Merchants were confused by the CTA on the header.
6/6 merchants thought the "Explore the app" CTA means "exploring the calculator by clicking this button."
02
Merchants found it too complicated to adjust items in the cart.
4/6 merchants considered it complicated to change the quantity of multiple items in the cart.
03
merchants want to calculate fulfillment cost and storage cost separately.
3/6 merchants explicitly expressed that they "would rather have different quantity selection for fulfillment cost and storage cost."
We learned from the testing and adjusted some of the features.

We also designed the mobile view based on the final design.

Business impact
We launched the calculator in early April. Within two weeks, we had 552 unique site visits and a 15% conversion rate, a substantial increase from our usual 5%. Clearly, the calculator has had a profoundly positive impact.
By the end of May, questions about pricing have decreased by 68.9% in support tickets, and questions about product eligibility also decreased by 20.2%.
